As a Middle School, getting transition right at Years 4-5 and Years 8-9 is of crucial importance. Firstly, for the learner to ensure both academic progression and personal development and secondly, for teachers and support staff to ensure that no time is wasted reorganising school structures due to lack of useful data.
A flight path of progression
To ensure that transition is correct, we utilise GL Assessment’s Progress Test Series. Through collaborative working with our First and High School partners, we have developed a system that allows robust and timely data to be shared. Year 4 pupils undertake both the Progress Test in Maths (PTM) and Progress Test in English (PTE) assessments in June, prior to their September start. We assess Year 8 pupils at the same time and then pass this data onto our High School partners.
This information provides us with the following:
- A profile of the learner cohort which is broken down into key groups
- A comparison of how our pupils are performing against the national average
- A clear understanding of the ability of pupils that are joining or leaving our Academy.
This allows us to:
- Set our English and maths classes ahead of the September start
- Tailor our curriculum, Teaching Assistant support and premium funding streams to match our cohort
- Work closely with partner First Schools to gain insight into pupils who need additional support
- Provide robust and aspirational targets for Year 5 early in the Autumn term.
To bolster this approach, we use the Progress Test Series in Years 5, 7 and 8 to provide a clear flight path of progression across our Middle School context and demonstrate progress from point of entry to the external end of Key Stage 2 SATs measure. This provides a distinct profile of progress made as a cohort, with a high level of detail present within the individual pupil report. The incremental improvement of individual pupils can be clearly demonstrated.
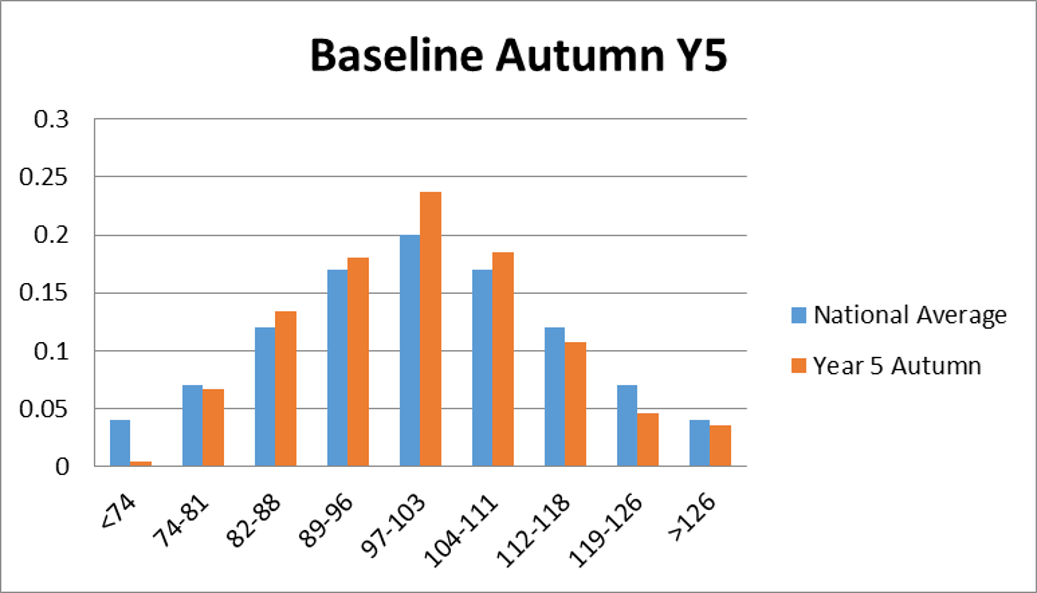
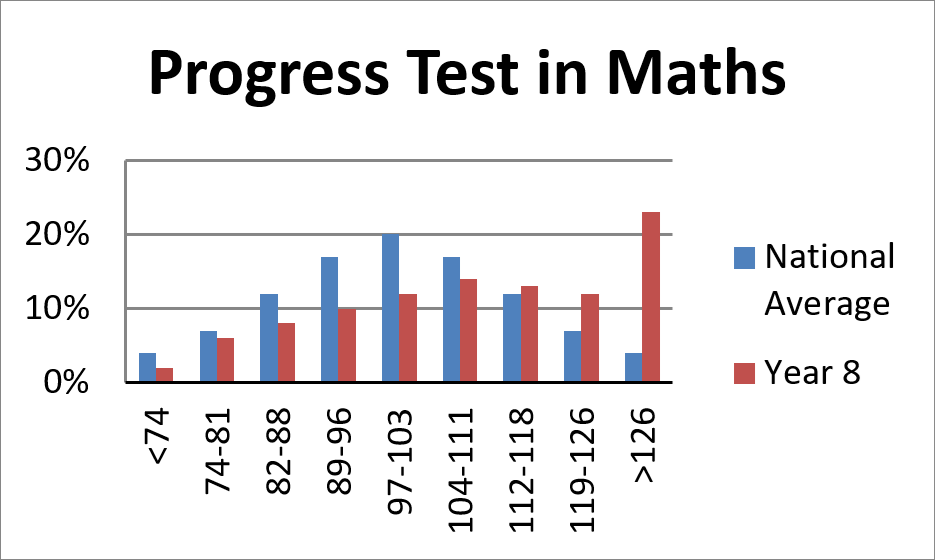
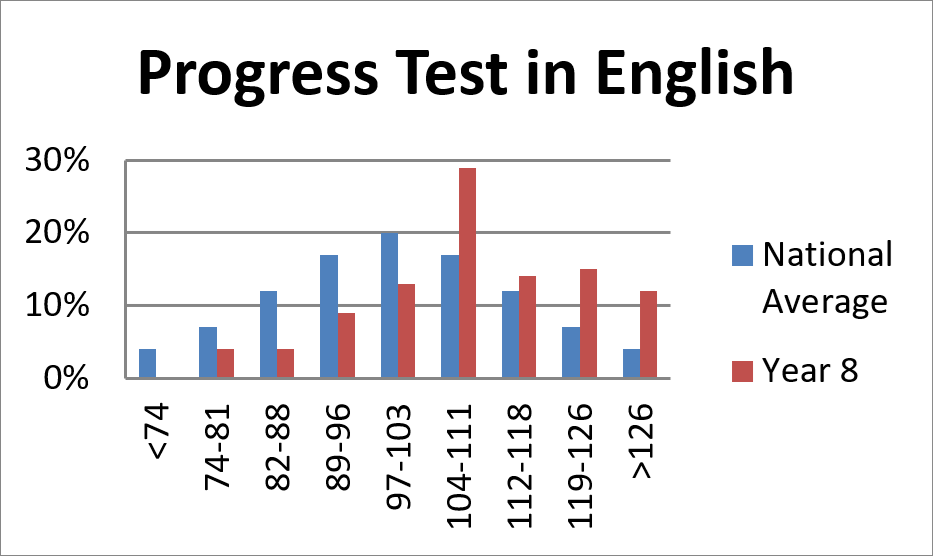
The graphs below are taken from GL Assessment information for the same year group cohort of approximately 190 pupils – the baseline being taken in Year 5 and the English and maths breakdowns being taken in Year 8, 4 academic years later:

Graph 1: Whole cohort baseline data compared to national for Year 5 on entry
We combined PTE and PTM data to demonstrate to all stakeholders the distribution of abilities within the cohort and provide a clear comparison against a significant national data set. The bell curve comparison is easily interpreted and explained to staff, governors and external agencies.

Graph 2 and Graph 3: Whole cohort baseline data compared to national for Year 8 on exit for Maths and English
This demonstrates to all stakeholders several elements.
- The attainment of the cohort compared to a national average cohort for KS3.
- A direct comparison to the baseline data in Graph 1 and therefore the progress for this cohort since joining the Academy.
- A clear portrait and comparison of the impact of teaching and learning on these pupils.
This clearly outlines the progress made by pupils across the four years within the Academy which has been difficult to demonstrate against a national data set until we began using GL Assessment.

Progress among these pupils is evident which is also reflected in their individual reports. In the current climate, progress is a key feature of how schools are held to account – specifically in the middle school context where formalised external assessment is at Year 6 rather than as a terminal assessment.
Being able to demonstrate progress from the point of entry to exit is crucial in showing the impact of the curriculum teaching and learning. Assessment data such as this (which can be compared against a statistically significant national data set and is now widely accepted by external assessors) is key to better teaching and learning and the demonstration of this.
St Edward’s Church of England Academy is one of our Centres of Assessment Excellence


