Multi-school dashboards: Smarter Insights, Stronger Impact
by Andy Small, Product Marketing Manager at Renaissance
Published
Introducing Reimagined Reporting Dashboards in Testwise
At Renaissance, incorporating GL Assessment and GL Education, we understand that data is only powerful when it’s actionable. That’s why we’re excited to unveil a reimagined reporting experience within the Testwise platform, designed specifically for multi-school leaders. These new dashboards mark a necessary, significant step forward in how we present your assessment data – allowing you to focus on using it to drive improvement across schools.
Why this matters
Group-level leaders – such as Directors of Education, Regional Directors and Data Leads – often face the challenge of pulling together data from multiple assessments to get a clear picture of performance. Our new dashboards support this by offering a unified view of headline metrics across the products you use. This enables leaders to quickly identify strengths, spot areas for support and make informed decisions with confidence.
Key benefits include:
- Group-wide visibility: View performance across schools and products in one place, helping leaders understand trends and patterns at a glance.
- Comparative analysis: Easily compare scores and bandings across settings to identify high-performing schools and those needing targeted support.
- Streamlined onboarding: Embedded walkthroughs and guidance help new users get value from the platform quickly, whilst built-in feedback tools allow them to shape future enhancements.
- Time-saving insights: Strategic users spend less time gathering and interpreting data, thanks to centralised metrics and automated comparisons.
- Accurate interpretation: Clear, consistent formatting and contextual guidance reduce the risk of misreading data and support the drawing of valid conclusions.
- Scalable delivery: The dashboards lay the groundwork for future enhancements, including exports, integrations, scheduled reports and tailored views. We’ll continue to work with school leaders to ensure that our revised reporting evolves in ways that truly meet the needs of those working with them each day.
Who are these dashboards for?
Tailored to the needs of colleagues with strategic responsibilities in multi-school groups – those responsible for turning assessment data into strategic action – we have been working with colleagues in Multi-Academy Trusts, independent school groups and international school groups to create a reporting experience that truly meets leaders’ needs.
While the initial release has focused on delivering core functionality, the dashboards have been built with scalability in mind. Prioritising user feedback, we anticipate future enhancements to include additional cards for extra assessments, more flexible delivery options such as data exports, additional charting and yet more filtering, as well as alternative views that empower the user to sort, hover and gain extra insight.
This adaptability ensures that the dashboards can evolve alongside user needs, supporting a wide range of requirements – from internal reporting to external accountability.
Looking ahead
This is more than a dashboard – it is a foundation for smarter decision-making. By surfacing the right data in the right ways, we’re helping leaders move from data collection to strategic insight, faster and more effectively than ever before.
We’re excited to collaborate with colleagues across the sector to drive improvement, support your schools and ultimately enhance outcomes for your learners.
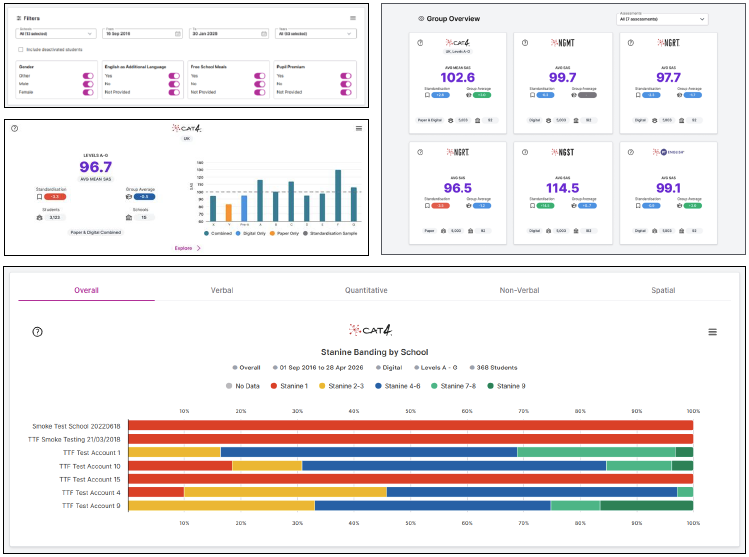
Please note that any imagery reflects designs only at this time and may be different to the final release.